empty
08.02.2023 08:17 PM
Technical analysis of EUR/USD for February 08, 2023

This image is no longer relevant

Overview:

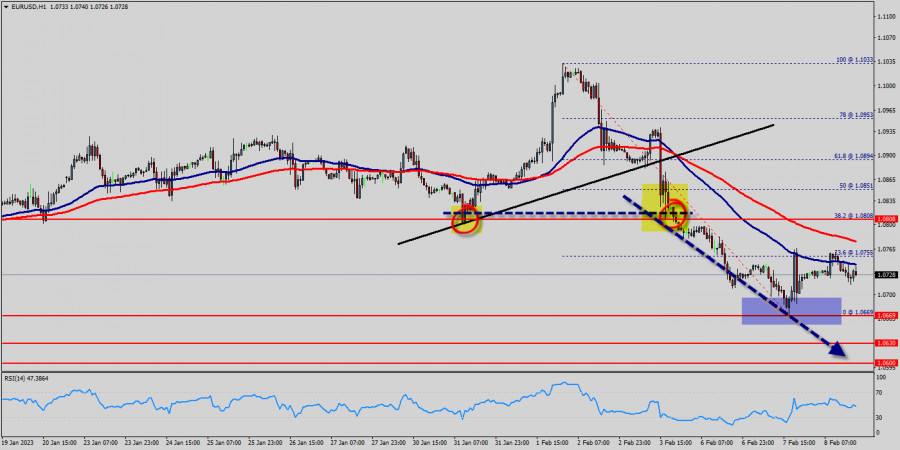
The EUR/USD pair has faced strong resistances at the levels of 1.0880 because support had become resistance last week. So, the strong resistance has been already formed at the level of 1.0880 and the pair is likely to try to approach it in order to test it again. However, if the pair fails to pass through the level of 1.0880, the market will indicate a bearish opportunity below the new strong resistance level of 1.0880 (the level of 1.0880 coincides with a ratio of 38.2% Fibonacci - last bullish wave - double top).

Moreover, the RSI starts signaling a downward trend, as the trend is still showing strength above the moving average (100) and (50). The trend of EUR/USD pair movement was controversial as it took place in the downtrend channel.

Due to the previous events, the price is still set between the levels of 1.0808 and 1.0669, so it is recommended to be careful while making deals in these levels because the prices of 1.0808 and 1.0669 are representing the resistance and support respectively.

Therefore, it is necessary to wait till the downtrend channel is passed through. Then the market will probably show the signs of a bearish market.

It should be noted that the volatility is very high for that the price of the EUR/USD pair is still trading between the prices of 1.0669 and 1.0808 in the coming hours.

Furthermore, the price has been set below the strong resistance at the levels of 1.0808 and 1.0851 which coincide with the 38.2% and 50% Fibonacci retracement levels respectively.

Thus, the market is indicating a bearish opportunity below 1.0808 so it will be good to sell at 1.0808 with the first target of 1.0669.

It will also call for a downtrend in order to continue towards 1.0630. The daily strong support is seen at 1.0600.

However, the stop loss should always be taken into account, for that it will be reasonable to set your stop loss at the level of 1.0851.

Moving averages, in the meantime, maintain their bearish slope way above the current level. Furthermore, although the news is bearish for the EUR/USD pair, professional may not want to sell weakness, but rather following a rebound rally.

Additionally, some aggressive counter-trend buyers may be defending parity. In case a continuousion takes place and the EUR/USD pair breaks through the support level of 1.0669 , a further decline to 1.0600 can occur which would indicate a bearish market.

Signal :

It should be noted that the 1.0808 price will act as a major resistance on Feb. 08th, 2023. Therefore, it will be too gainful to sell short below 1.0808 and look for further downside with 1.0669, 1.0630 and 1.0600 targets. It should also be reminded that stop loss must never exceed the maximum exposure amounts. Thus, stop loss should be placed at the 1.0851 level today.

เลือกช่วงเวลา
5
นาที
15
นาที
30
นาที
1
ชั่วโมง
4
ชั่วโมง
1
วัน
1
สัปดาห์
รับผลกำไรจากการเปลี่ยนแปลงอัตราสกุลเงินดิจิทัลกับ InstaForex.
ดาวน์โหลด MetaTrader 4 และเปิดการซื้อขายครั้งแรกของคุณ.
  • Grand Choice
    Contest by
    InstaForex
    InstaForex always strives to help you
    fulfill your biggest dreams.
    เข้าร่วมการแข่งขัน


บทความแนะนำ

การวิเคราะห์ทางเทคนิคของการเคลื่อนไหวของราคาภายในวัน คู่สกุลเงินข้าม EUR/GBP วันจันทร์ที่ 21 เมษายน 2025

จากที่เห็นในกราฟ 4 ชั่วโมง คู่สกุลเงิน EUR/GBP ดูเหมือนจะเคลื่อนไหวเหนือเส้น EMA (100) ซึ่งบ่งบอกว่าผู้ซื้อมีอิทธิพลเหนือคู่สกุลเงินนี้ ดังนั้นในอนาคตอันใกล้ ตราบใดที่ไม่มีการแก้ไขที่อ่อนแอที่ทะลุและปิดต่ำกว่าระดับ 0.8521 EUR/GBP มีโอกาสที่จะคุ้มค่าและเพิ่มขึ้นถึงระดับ 0.8613

Arief Makmur 04:19 2025-04-21 UTC+2

การวิเคราะห์ทางเทคนิคของการเคลื่อนไหวของราคาในระหว่างวัน คู่สกุลเงินหลัก USD/JPY วันจันทร์ที่ 21 เมษายน 2025

จากการเกิดการบรรจบกันระหว่างการเคลื่อนไหวของราคาของคู่สกุลเงินหลัก USD/JPY กับตัวชี้วัด Stochastic Oscillator และตำแหน่งของ EMA (100) ที่อยู่เหนือราคานั้น ในอนาคตอันใกล้นี้ USD/JPY มีแนวโน้มที่จะอ่อนค่าลงต่อไป โดยตราบใดที่ยังไม่มีการเสริมกำลังเพิ่มเติมที่ฝ่าและปิดเหนือระดับ 149.43 USD/JPY

Arief Makmur 04:19 2025-04-21 UTC+2

การคาดการณ์ Forex ประจำวันที่ 18/04/2025: EUR/USD, GBP/USD, ทองคำ และ Bitcoin

ลิงก์ที่เป็นประโยชน์: บทความอื่น ๆ ของฉันสามารถอ่านได้ในส่วนนี้ คอร์สเริ่มต้น InstaForex สำหรับผู้เริ่มต้น การวิเคราะห์ที่ได้รับความนิยม เปิดบัญชีซื้อขาย สำคัญ: ผู้เริ่มต้นในตลาดฟอเร็กซ์ต้องระมัดระวังอย่างมากในการตัดสินใจเข้าสู่ตลาด ก่อนที่รายงานสำคัญจะถูกปล่อยออกมา คุณควรออกจากตลาดก่อน เพื่อหลีกเลี่ยงผลกระทบของความผันผวนที่เพิ่มขึ้น หากคุณตัดสินใจทำการซื้อขายในขณะนี้

Sebastian Seliga 10:18 2025-04-18 UTC+2

ทองคำ: ความไม่แน่นอนที่เกิดขึ้นอย่างต่อเนื่องยังคงสนับสนุนราคาทองคำ

ราคาทองคำยังคงได้รับแรงสนับสนุนท่ามกลางความไม่แน่นอนเกี่ยวกับเส้นทางในอนาคตของสงครามภาษีที่ริเริ่มโดย Donald Trump ราคาทองคำได้พุ่งสูงขึ้นอย่างต่อเนื่องเป็นเวลากว่า 4 เดือน โดยปัจจัยหลักคือความหวาดกลัวที่เพิ่มขึ้นว่าศักยภาพทางเศรษฐกิจโลกอาจพังทลายลงภายใต้ความตึงเครียดที่เพิ่มขึ้น—โดยเฉพาะการเผชิญหน้าระหว่างปักกิ่งและวอชิงตัน ในเชิงเทคนิคแล้ว ราคาของโลหะมีค่านี้มีการซื้อมากเกินไปและอาจพังทลายลงได้ทุกเมื่อหากมีข่าวเกี่ยวกับข้อตกลงทางการค้าระหว่างสหรัฐฯ และจีนปรากฏออกมา แม้ยังไม่มีจุดจบที่ชัดเจนสำหรับการเผชิญหน้านี้ แต่เมื่อพิจารณาจากท่าทีที่เด็ดเดี่ยวของปักกิ่ง การเดินเกมของ Trump และความเสี่ยงทางเศรษฐกิจที่แท้จริง—โดยเฉพาะในสหรัฐฯ—จึงถือเป็นเรื่องสมเหตุสมผลที่จะคาดหวังว่าการเจรจาระหว่างทั้งสองประเทศจะเริ่มขึ้นในที่สุด

Pati Gani 11:49 2025-04-17 UTC+2

การคาดการณ์ค่าเงิน EUR/USD สำหรับวันที่ 17 เมษายน 2025

เมื่อวันพุธที่ผ่านมา ยูโรเคลื่อนเข้าสู่ช่วงเป้าหมายที่ 1.1385–1.1420 อีกครั้ง แต่พฤติกรรมการเคลื่อนไหวของราคาเมื่อไม่นานมานี้ชี้ให้เห็นว่าระดับ 1.1385 อาจจะไม่สำคัญแล้ว — เรากำลังเห็นช่วงการเคลื่อนไหวระหว่าง 1.1276 ถึง 1.1420 ภายในช่วงนี้ ยูโรจะรอติดตามผลการประชุม

Laurie Bailey 11:07 2025-04-17 UTC+2

การพยากรณ์ GBP/USD สำหรับวันที่ 17 เมษายน 2025

เมื่อวานนี้ สหราชอาณาจักรได้เปิดเผยข้อมูลอัตราเงินเฟ้อสำหรับเดือนมีนาคม โดย Core CPI ลดลงจาก 3.0% y/y เป็น 2.8% y/y และ headline CPI ลดลงจาก

Laurie Bailey 11:02 2025-04-17 UTC+2

การพยากรณ์ USD/CAD สำหรับวันที่ 17 เมษายน 2025

USD/CAD บนกราฟรายวัน ตัวบ่งชี้ Marlin แสดงถึงแนวโน้มที่ราคามีโอกาสกลับตัวขึ้น ในขณะที่ด้านล่างยังคงมีระดับเป้าหมายที่ 1.3746 และขอบล่างของช่องราคาซึ่งตามสมมติฐานอาจถูกทดสอบที่ระดับประมาณ 1.3668 อย่างไรก็ตาม ตลอดประวัติศาสตร์ของกราฟ ราคามีการเข้าใกล้เส้นล่างของช่องทางนี้หกครั้งโดยไม่ทดสอบเส้นตรง ดังนั้นจึงไม่สามารถถือเป็นสัญญาณที่น่าเชื่อถือได้ การรวมตัวเหนือระดับ 1.3898

Laurie Bailey 10:59 2025-04-17 UTC+2

การคาดการณ์ Forex วันที่ 17/04/2025: EUR/USD, NZD/USD, USD/JPY, SP500 และ Bitcoin

ลิงก์ที่มีประโยชน์: บทความอื่นๆ ของฉันสามารถหาอ่านได้ในส่วนนี้ คอร์ส InstaForex สำหรับผู้เริ่มต้น การวิเคราะห์ยอดนิยม เปิดบัญชีซื้อขาย สำคัญ: ผู้เริ่มต้นในการซื้อขายฟอเร็กซ์ต้องระมัดระวังเป็นอย่างยิ่งเมื่อทำการตัดสินใจเกี่ยวกับการเข้าสู่ตลาด ก่อนการประกาศรายงานที่สำคัญ ควรหลีกเลี่ยงการเข้าตลาดเพื่อป้องกันไม่ให้ถูกจับในความผันผวนของตลาดที่รุนแรงเนื่องจากความผันผวนที่เพิ่มขึ้น หากคุณตัดสินใจที่จะทำการซื้อขายในระหว่างการประกาศข่าว ควรวางคำสั่งหยุดขาดทุนเสมอเพื่อลดการสูญเสีย หากไม่วางคำสั่งหยุดขาดทุน

Sebastian Seliga 10:59 2025-04-17 UTC+2

การวิเคราะห์ทางเทคนิคของการเคลื่อนไหวราคาภายในวันของดัชนี Nasdaq 100, วันพฤหัสบดีที่ 17 เมษายน 2025

จากสิ่งที่เราสังเกตเห็นในแผนภูมิ 4 ชั่วโมงของดัชนี Nasdaq 100 มีสิ่งที่น่าสนใจหลายประการ ได้แก่ อย่างแรก การเคลื่อนไหวของราคากำลังเคลื่อนที่ต่ำกว่าเส้น MA (100); อย่างที่สอง ปรากฏแพทเทิร์นสามเหลี่ยม; และอย่างที่สาม มีการปรากฏของแพทเทิร์น

Arief Makmur 06:27 2025-04-17 UTC+2

สัญญาณการซื้อขายสำหรับทองคำ (XAU/USD) ระหว่างวันที่ 16-18 เมษายน 2025: ขายต่ำกว่า $3,320 (ภาวะซื้อมากเกิน - 21 SMA)

ในช่วงเช้าของการซื้อขายอเมริกัน ทองคำกำลังซื้อขายอยู่ที่ประมาณ 3,312 โดยมีแนวโน้มเพิ่มขึ้นหลังจากการเบรกเอาท์จากรูปสามเหลี่ยมสมมาตร ขณะนี้เป็นไปได้ว่าทองคำจะขึ้นต่อในอีกไม่กี่ชั่วโมงข้างหน้า โดยมีเป้าหมายอยู่ที่ระดับ 7/8 ของ Murray ที่ 3,359 ทองคำสามารถทำราคาสูงสุดใหม่ในขณะนี้ เนื่องจากแนวโน้มกำลังอยู่ในช่วงขาขึ้นที่แข็งแกร่ง ราคาประมาณ 3,319.45

Dimitrios Zappas 18:20 2025-04-16 UTC+2
หากไม่สะดวกคุยในตอนนี้
ระบุคำถามไว้ได้ใน แชท.
Widget callback
 

Dear visitor,

Your IP address shows that you are currently located in the USA. If you are a resident of the United States, you are prohibited from using the services of InstaFintech Group including online trading, online transfers, deposit/withdrawal of funds, etc.

If you think you are seeing this message by mistake and your location is not the US, kindly proceed to the website. Otherwise, you must leave the website in order to comply with government restrictions.

Why does your IP address show your location as the USA?

  • - you are using a VPN provided by a hosting company based in the United States;
  • - your IP does not have proper WHOIS records;
  • - an error occurred in the WHOIS geolocation database.

Please confirm whether you are a US resident or not by clicking the relevant button below. If you choose the wrong option, being a US resident, you will not be able to open an account with InstaForex anyway.

We are sorry for any inconvenience caused by this message.