signal strength 4 of 5

According to the chart of H1, #Bitcoin formed the Bearish Rectangle. This type of a pattern indicates a trend continuation. It consists of two levels: resistance 84685.39 - 0.00 and support 81178.46 – 81178.46. In case the resistance level 81178.46 - 81178.46 is broken, the instrument is likely to follow the bearish trend.
Veja também
- All
- Double Top
- Flag
- Head and Shoulders
- Pennant
- Rectangle
- Triangle
- Triple top
- All
- #AAPL
- #AMZN
- #Bitcoin
- #EBAY
- #FB
- #GOOG
- #INTC
- #KO
- #MA
- #MCD
- #MSFT
- #NTDOY
- #PEP
- #TSLA
- #TWTR
- AUDCAD
- AUDCHF
- AUDJPY
- AUDUSD
- EURCAD
- EURCHF
- EURGBP
- EURJPY
- EURNZD
- EURRUB
- EURUSD
- GBPAUD
- GBPCHF
- GBPJPY
- GBPUSD
- GOLD
- NZDCAD
- NZDCHF
- NZDJPY
- NZDUSD
- SILVER
- USDCAD
- USDCHF
- USDJPY
- USDRUB
- All
- M5
- M15
- M30
- H1
- D1
- All
- Buy
- Sale
- All
- 1
- 2
- 3
- 4
- 5

De acordo com o gráfico de M5, GOLD formou o padrão Triângulo Simétrico de Baixa. Descrição: o limite inferior é 3314.14/3331.45 e o limite superior é 3343.45/3331.45. A largura
Os intervalos M5 e M15 podem ter mais pontos de entrada falsos.
Open chart in a new window
O padrão Fundo triplo foi formado no gráfico de EURUSD H1. Características do padrão: A linha inferior do padrão tem coordenadas 1.1439 com o limite superior 1.1439/1.1357, a projeção
Open chart in a new window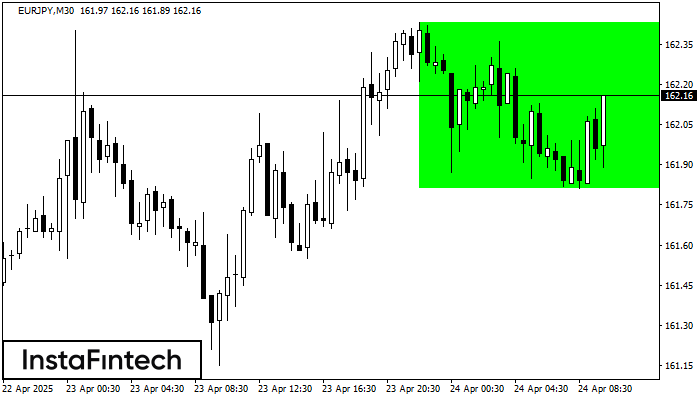
De acordo com o gráfico de M30, EURJPY formou Retângulo de alta. O padrão indica uma continuação da tendência. O limite superior é 162.43, o limite inferior é 161.81
Open chart in a new window