Forecast for February 21:
Analytical review of currency pairs in scale H1:
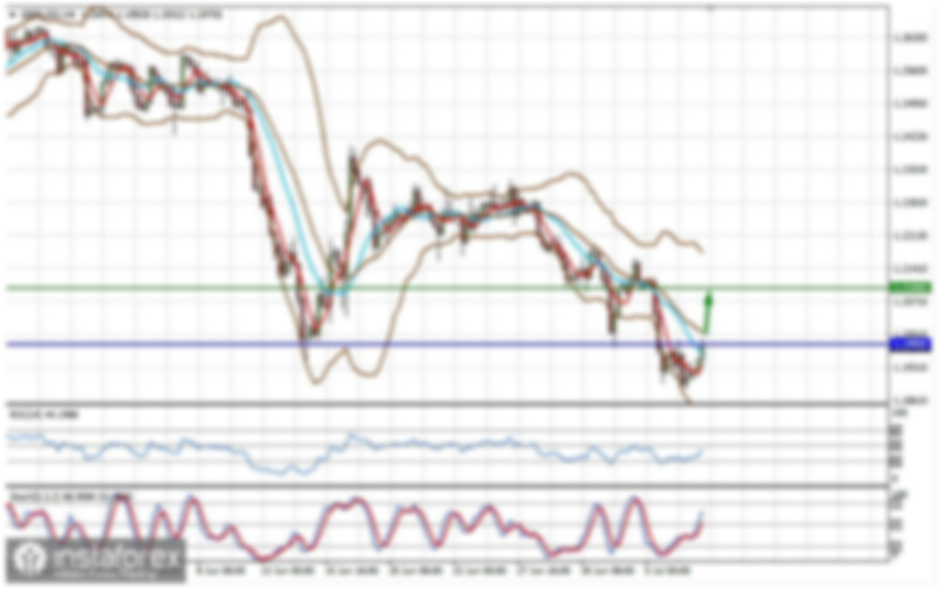
For the euro / dollar pair, the key levels on the H1 scale are: 1.0891, 1.0861, 1.0832, 1.0807, 1.0775 and 1.0751. Here, we expect a correction in a downward trend. Short-term upward movement is expected after the breakdown of the level of 1.0807. Here, the target is 1.0832. The breakdown of which will lead to in-depth movement. In this case, the target is 1.0861. This level is a key resistance for the subsequent development of the ascending structure. For the potential value for the top, we consider the level of 1.0891. We await the design of expressed initial conditions before this value.
Short-term downward movement is expected in the range 1.0775 - 1.0751. From here, we expect a reversal to the top.
The main trend is a downward structure from January 31, we expect a correction
Trading recommendations:
Buy: 1.0807 Take profit: 1.0830
Buy: 1.0834 Take profit: 1.0860
Sell: 1.0775 Take profit: 1.0752
Sell: Take profit:
For the pound / dollar pair, the key levels on the H1 scale are: 1.2990, 1.2955, 1.2932, 1.2891, 1.2863, 1.2827 and 1.2804. Here, we are following the development of the downward cycle of February 13. Short-term downward movement is expected in the range 1.2891 - 1.2863. The breakdown of the latter value will lead to a pronounced movement. Here, the target is 1.2827. For the potential value for the bottom, we consider the level of 1.2804. Upon reaching which, we expect consolidation, as well as a rollback to the top.
Short-term upward movement is possibly in the range of 1.2932 - 1.2955. The breakdown of the latter value will lead to an in-depth correction. Here, the target is 1.2990. This level is a key support for the downward structure.
The main trend is the downward cycle of February 13.
Trading recommendations:
Buy: 1.2924 Take profit: 1.2954
Buy: 1.2957 Take profit: 1.2990
Sell: 1.2861 Take profit: 1.2828
Sell: 1.2802 Take profit: 1.2755
For the dollar / franc pair, the key levels on the H1 scale are: 0.9899, 0.9883, 0.9858, 0.9819, 0.9804 and 0.9783. Here, we are following the local ascendant structure of February 12. The continuation of movement to the top is expected after the breakdown of the level of 0.9858. In this case, the target is 0.9883. We consider the level of 0.9899 to be a potential value for the ascending structure. Upon reaching which, we expect consolidation, as well as a pullback to the bottom.
Short-term downward movement is possibly in the range of 0.9819 - 0.9804. The breakdown of the latter value will lead to an in-depth correction. Here, the target is 0.9783. This level is a key support for the top.
The main trend is the local potential for the top of February 12
Trading recommendations:
Buy : 0.9858 Take profit: 0.9880
Buy : 0.9883 Take profit: 0.9899
Sell: 0.9819 Take profit: 0.9805
Sell: 0.9803 Take profit: 0.9784
For the dollar / yen pair, the key levels on the scale are : 112.97, 112.53, 112.29, 111.84, 111.51 and 111.10. Here, we are following the development of the ascending structure of January 31. Short-term upward movement is expected in the range 112.29 - 112.53. The breakdown of the last value will lead to a pronounced movement to the potential target - 112.97, and when this level is reached, we expect a pullback to the bottom.
Short-term downward movement is possibly in the range of 111.84 - 111.51. The breakdown of the last value will lead to an in-depth correction. Here, the goal is 111.10. This level is a key support for the top.
Main trend: upward structure of January 31
Trading recommendations:
Buy: 112.30 Take profit: 112.52
Buy : 112.55 Take profit: 112.95
Sell: 111.82 Take profit: 111.53
Sell: 111.49 Take profit: 111.12
For the Canadian dollar / US dollar pair, the key levels on the H1 scale are: 1.3281, 1.3259, 1.3242, 1.3201, 1.3165, 1.3137 and 1.3105. Here, the descending structure of February 10 is considered medium-term. The continuation of the movement to the bottom is expected after the breakdown of the level of 1.3201. In this case, the target is 1.3165. Short-term downward movement, as well as consolidation is in the range of 1.3165 - 1.3137. For the potential value for the top, we consider the level of 1.3105. The movement to which is expected after the breakdown of the level of 1.3135.
Short-term upward movement is possibly in the range of 1.3259 - 1.3281. The breakdown of the latter value will lead to the formation of an upward structure. In this case, the potential target is 1.3328.
The main trend is the descending structure of February 10, the correction stage
Trading recommendations:
Buy: 1.3260 Take profit: 1.3280
Buy : 1.3284 Take profit: 1.3325
Sell: 1.3200 Take profit: 1.3165
Sell: 1.3163 Take profit: 1.3140
For the Australian dollar / US dollar pair, the key levels on the H1 scale are : 0.6668, 0.6647, 0.6632, 0.6614, 0.6594, 0.6567 and 0.6551. Here, we are following the descending structure of February 12. Short-term downward movement is expected in the range of 0.6614 - 0.6594. The breakdown of the latter value will lead to a pronounced downward movement. Here, the target is 0.6567. For the potential value for the bottom, we consider the level of 0.6551. Upon reaching which, we expect consolidation, as well as a rollback to the top.
Short-term upward movement is possibly in the range of 0.6632 - 0.6647. The breakdown of the latter value will lead to an in-depth correction. Here, the target is 0.6668. This level is a key support for the downward structure.
The main trend is the descending structure of February 12
Trading recommendations:
Buy: 0.6632 Take profit: 0.6645
Buy: 0.6649 Take profit: 0.6666
Sell : 0.6612 Take profit : 0.6596
Sell: 0.6592 Take profit: 0.6569
For the euro / yen pair, the key levels on the H1 scale are: 123.38, 122.61, 122.04, 121.25, 120.97, 120.50, 119.97 and 119.44. Here, we are following the initial conditions for the top of February 18. The continuation of the movement to the top is expected after the price passes the noise range 120.97 - 121.25. In this case, the target is 122.04. Short-term upward movement, as well as consolidation is in the range of 122.04 - 122.61. For the potential value for the top, we consider the level of 123.38. Upon reaching this level, we expect a pullback to the bottom.
Short-term downward movement is possibly in the range of 120.50 - 119.97. The breakdown of the last value will lead to an in-depth correction. Here, the target is 119.44. This level is a key support for the upward structure.
The main trend is the formation of initial conditions for the top of February 18
Trading recommendations:
Buy: 121.25 Take profit: 122.04
Buy: 122.06 Take profit: 122.60
Sell: 120.50 Take profit: 120.00
Sell: 120.95 Take profit: 119.47
For the pound / yen pair, the key levels on the H1 scale are : 146.35, 145.56, 145.19, 144.60, 143.89, 143.51 and 142.91. Here, we are following the ascending structure of February 10. The continuation of the movement to the top is expected after the breakdown of the level of 144.60. In this case, the target is 145.19. Short-term upward movement, as well as consolidation is in the range of 145.19 - 145.56. For the potential value for the top, we consider the level of 146.35. Upon reaching this value, we expect a pullback to the bottom.
Short-term downward movement is possibly in the range of 143.89 - 143.51; hence, the high probability of a reversal to the top. The breakdown of the level of 143.50 will lead to an in-depth correction. Here, the goal is 142.91. This level is a key support for the top.
The main trend is the rising structure of February 10
Trading recommendations:
Buy: 144.60 Take profit: 145.19
Buy: 145.21 Take profit: 145.54
Sell: 143.87 Take profit: 143.52
Sell: 143.49 Take profit: 142.95