signal strength 1 of 5
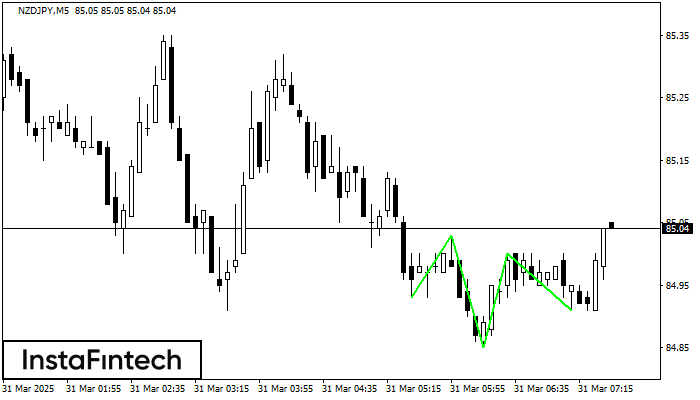
According to the chart of M5, NZDJPY formed the Inverse Head and Shoulder pattern. The Head’s top is set at 85.00 while the median line of the Neck is found at 84.85/84.91. The formation of the Inverse Head and Shoulder pattern evidently signals a reversal of the downward trend. In other words, in case the scenario comes true, the price of NZDJPY will go towards 85.15
The M5 and M15 time frames may have more false entry points.
Juga lihat
- All
- Double Top
- Flag
- Head and Shoulders
- Pennant
- Rectangle
- Triangle
- Triple top
- All
- #AAPL
- #AMZN
- #Bitcoin
- #EBAY
- #FB
- #GOOG
- #INTC
- #KO
- #MA
- #MCD
- #MSFT
- #NTDOY
- #PEP
- #TSLA
- #TWTR
- AUDCAD
- AUDCHF
- AUDJPY
- AUDUSD
- EURCAD
- EURCHF
- EURGBP
- EURJPY
- EURNZD
- EURRUB
- EURUSD
- GBPAUD
- GBPCHF
- GBPJPY
- GBPUSD
- GOLD
- NZDCAD
- NZDCHF
- NZDJPY
- NZDUSD
- SILVER
- USDCAD
- USDCHF
- USDJPY
- USDRUB
- All
- M5
- M15
- M30
- H1
- D1
- All
- Buy
- Sale
- All
- 1
- 2
- 3
- 4
- 5

The Bearish pennant pattern has formed on the GBPAUD M5 chart. This pattern type is characterized by a slight slowdown after which the price will move in the direction
The M5 and M15 time frames may have more false entry points.
Open chart in a new window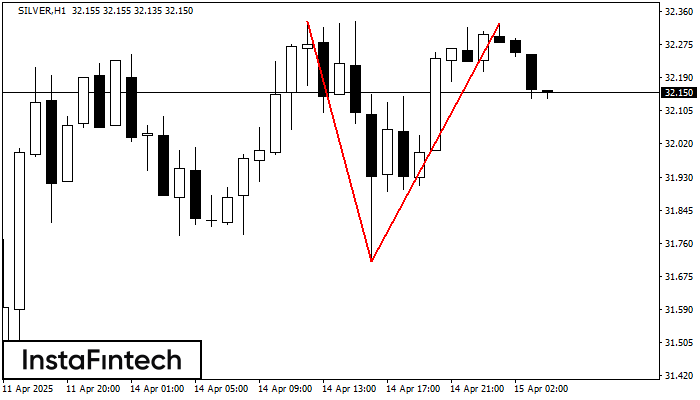
On the chart of SILVER H1 the Double Top reversal pattern has been formed. Characteristics: the upper boundary 32.33; the lower boundary 31.71; the width of the pattern 615 points
Open chart in a new window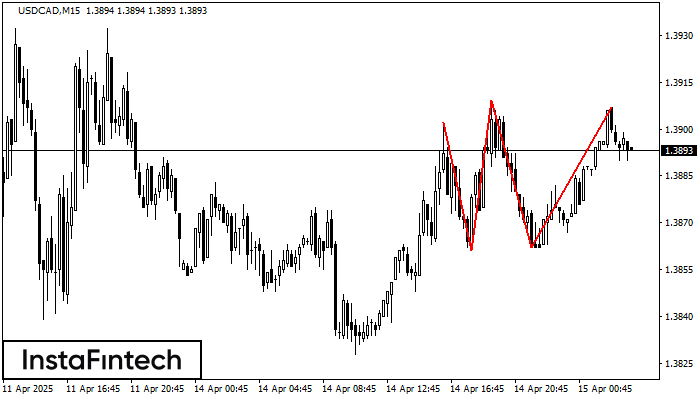
The Triple Top pattern has formed on the chart of the USDCAD M15 trading instrument. It is a reversal pattern featuring the following characteristics: resistance level -5, support level -1
The M5 and M15 time frames may have more false entry points.
Open chart in a new window