empty
13.01.2025 12:11 PM
Weekly Forecast Based on Simplified Wave Analysis for EUR/USD, USD/JPY, GBP/JPY, USD/CAD, EUR/GBP, and Gold on January 13th

EUR/USD

Analysis:

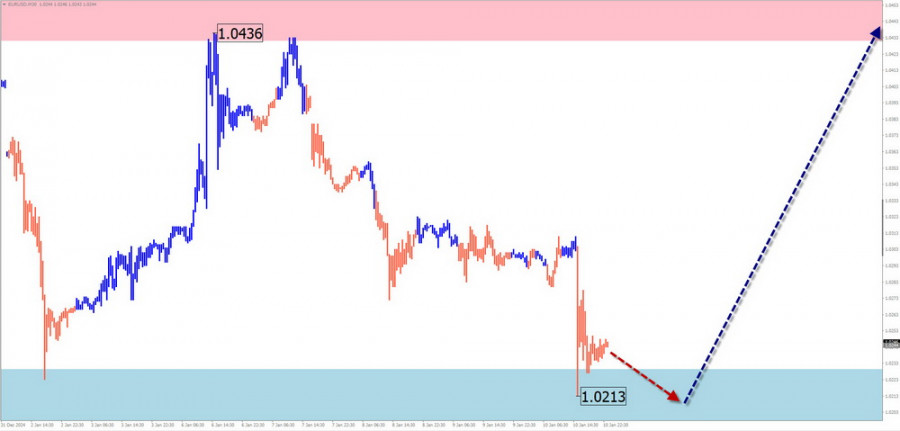
The bearish wave of the euro major, which began in August last year, has reached the upper boundary of the preliminary target zone. The structure of the entire wave does not appear to be complete as of this analysis. Since January 2, a bullish segment has been forming along this level.

Forecast:

In the coming days, the sideways movement of the euro is expected to continue. After a potential attempt to test the lower reversal zone, a directional shift and a price increase toward the resistance zone are anticipated. A temporary breakout below the calculated support boundary cannot be ruled out if the direction changes.

This image is no longer relevant

Potential Reversal Zones:

  • Resistance: 1.0430/1.0480
  • Support: 1.0230/1.0180

Recommendations:

  • Sales: Risky and may result in deposit losses.
  • Purchases: Possible only after confirmed reversal signals appear on your trading system (TS) in the support area.

USD/JPY

Analysis:

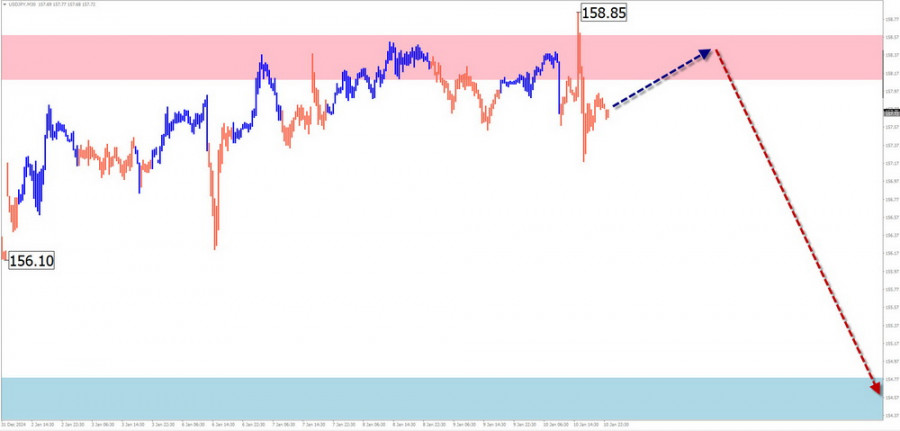
Since August last year, the Japanese yen major has predominantly moved upward, forming an extended ascending flat. Recently, a corrective pullback has been forming from the intermediate resistance zone, mostly in a sideways trajectory. The correction phase must fully complete before further price growth can resume.

Forecast:

The overall sideways price movement is likely to continue next week. Early in the week, there may be temporary pressure on the resistance zone, followed by a likely directional shift and the beginning of a decline. The support zone marks the lower boundary of the pair's preliminary weekly range.

This image is no longer relevant

Potential Reversal Zones:

  • Resistance: 158.10/158.60
  • Support: 154.80/154.30

Recommendations:

  • Purchases: Risky and may result in deposit losses.
  • Sales: Can be considered with a small lot after confirmed reversal signals.

GBP/JPY

Analysis:

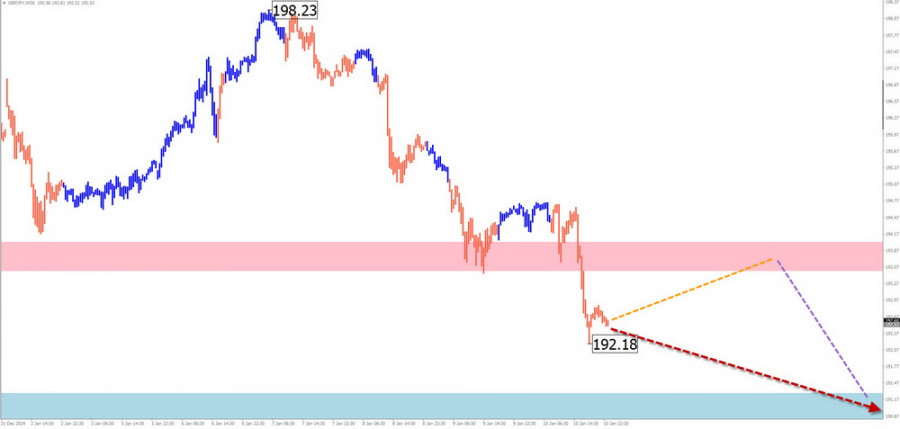
The bearish wave from December 7 last year dictates the short-term trend direction for the GBP/JPY pair. This movement segment has reversal potential, going beyond a correction of the previous primary wave segment. Currently, the price has broken through intermediate support, which has turned into resistance.

Forecast:

A continuation of the downward price vector is expected this week. Temporary pressure on the resistance zone may occur in the next couple of days. Increased volatility and the beginning of active price declines are more likely toward the end of the week.

This image is no longer relevant

Potential Reversal Zones:

  • Resistance: 193.50/194.00
  • Support: 191.30/190.80

Recommendations:

  • Purchases: Risky and may incur losses.
  • Sales: Can be used in trading after appropriate reversal signals near the resistance area.

USD/CAD

Analysis:

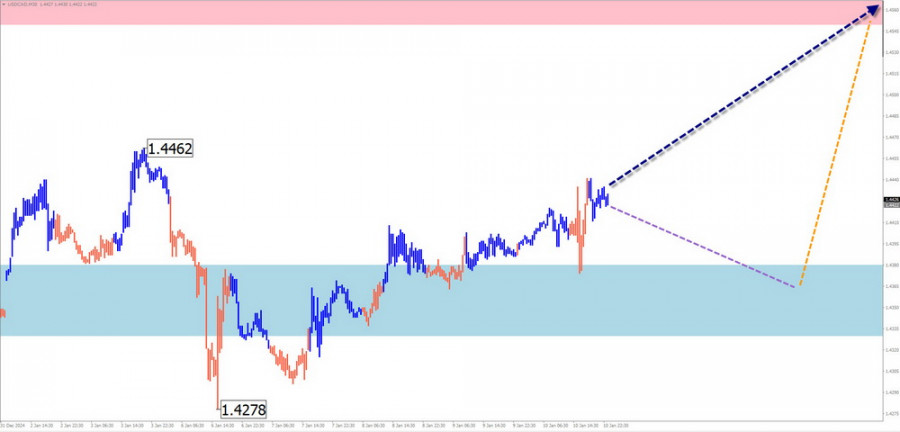
The primary price direction for the USD/CAD major has been dictated by an ascending wave since late September last year. A counterwave structure, remaining within correction boundaries, has been forming since the end of the year. The pair's quotes are now above the intermediate reversal zone, which has become support after being breached.

Forecast:

The sideways trend in price fluctuations is expected to persist early next week. Pressure on the support zone cannot be ruled out. Subsequently, a reversal is likely, and price growth toward the resistance area may resume.

This image is no longer relevant

Potential Reversal Zones:

  • Resistance: 1.4550/1.4600
  • Support: 1.4330/1.4280

Recommendations:

  • Sales: Limited potential and high risk.
  • Purchases: Viable after reversal signals appear near the calculated support area on your trading system.

EUR/GBP

Analysis:

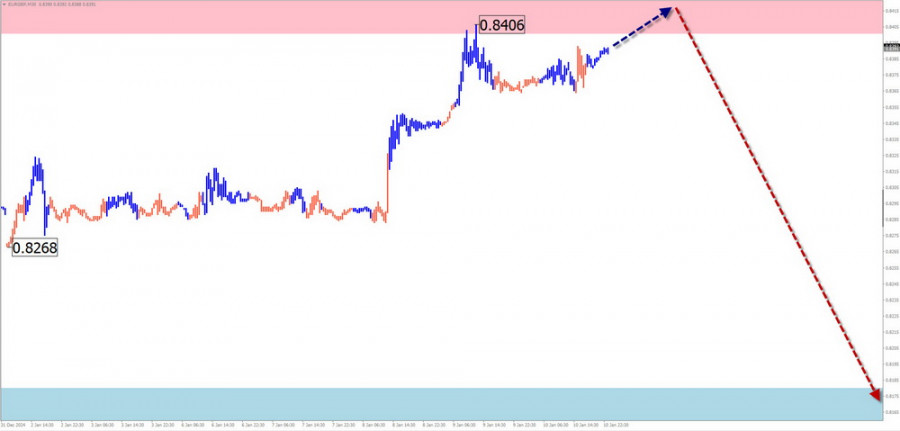
The current wave structure of the EUR/GBP pair began in August last year. Since October, sideways drifting has formed the correctional part (B), which remains incomplete. The pair's quotes are confined to a narrow range between significant daily timeframe reversal zones.

Forecast:

An upward movement is expected to continue in the coming days. Near the resistance zone, a reversal and a renewed downward movement are anticipated. The highest activity is likely toward the weekend.

This image is no longer relevant

Potential Reversal Zones:

  • Resistance: 0.8400/0.8450
  • Support: 0.8180/0.8130

Recommendations:

  • Sales: Viable after appropriate reversal signals appear near the resistance zone with a small lot.
  • Purchases: Unpromising and highly risky.

Gold

Analysis:

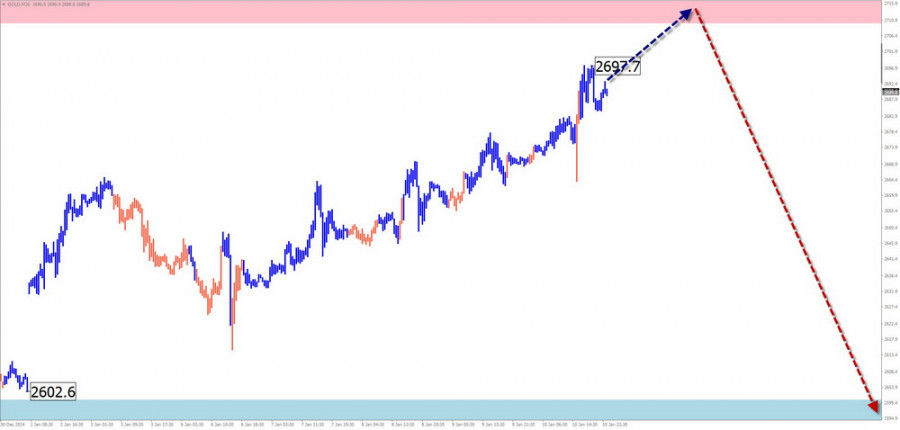
Since late October last year, a counterwave has been forming on the gold chart from record highs. This section forms a correction within a larger wave structure. Lines drawn through the extrema on the gold chart reveal a "horizontal pennant" price pattern, which remains incomplete as of this analysis.

Forecast:

The overall sideways trend is expected to continue next week. Initial pressure on the resistance zone is likely. Subsequently, a reversal and downward movement are anticipated. The calculated support level limits the expected range of the instrument's decline.

This image is no longer relevant

Potential Reversal Zones:

  • Resistance: 2710.0/2730.0
  • Support: 2600.0/2580.0

Recommendations:

  • Purchases: Limited potential and high risk.
  • Sales: Possible after reversal signals appear near the calculated support area using your trading system.

Explanations:

In simplified wave analysis (SWA), all waves consist of three parts (A-B-C). The analysis focuses on the last, incomplete wave at each timeframe. Dashed lines indicate expected movements.

Note: The wave algorithm does not account for the duration of instrument movements over time.

EURUSD
Euro vs US Dollar
Ringkasan
Beli
Segera
1 minggu
Analitic
Vyacheslav Ognev
Mulakan perdagangan
Jana pendapatan melalui perubahan kadar mata wang kripto dengan InstaForex.
Muat turun MetaTrader 4 dan buka dagangan pertama anda.
  • Grand Choice
    Contest by
    InstaForex
    InstaForex always strives to help you
    fulfill your biggest dreams.
    SERTAI PERADUAN

Artikel yang dicadangkan

Ramalan Mingguan Berdasarkan Analisis Gelombang Ringkas untuk GBP/USD, AUD/USD, USD/CHF, EUR/JPY, EUR/CHF, dan Indeks Dolar AS pada 20 Januari

Analisis:Struktur gelombang terbaru untuk GBP/USD, yang dimulai pada bulan Ogos tahun lalu, masih belum lengkap dan sedang menurun. Bahagian ini berfungsi sebagai pembetulan dalam gelombang yang lebih besar. Sepanjang minggu

Isabel Clark 13:16 2025-01-20 UTC+2

Ramalan Mingguan Berdasarkan Analisis Gelombang Ringkas untuk EUR/USD, USD/JPY, GBP/JPY, USD/CAD, NZD/USD dan Emas pada 20 Januari

Euro mungkin akan meneruskan pergerakan mendatar secara keseluruhan pada minggu depan. Dalam beberapa hari akan datang, mungkin terdapat tekanan pada zon sokongan, dengan kemungkinan berlaku penembusan singkat di bawah sempadan

Isabel Clark 13:03 2025-01-20 UTC+2

Analisis untuk EUR/USD pada 7 Januari 2025

Pola gelombang pada carta 4-jam untuk EUR/USD semakin jelas. Sejak 25 September, struktur penurunan baharu sedang terbentuk, yang telah kelihatan seperti satu gelombang impulsif. Gelombang kelima, seperti yang saya jangkakan

Chin Zhao 15:52 2025-01-07 UTC+2

Analisis untuk GBP/USD pada 7 Januari 2025

Corak gelombang bagi pasangan GBP/USD kekal agak samar tetapi secara keseluruhan mudah difahami. Pada masa ini, terdapat kebarangkalian tinggi pembentukan segmen aliran menurun jangka panjang. Gelombang 5 semasa telah membentuk

Chin Zhao 15:48 2025-01-07 UTC+2

Analisis untuk EUR/USD pada 6 Januari 2025

Pola gelombang pada carta 4 jam untuk EUR/USD semakin jelas. Satu struktur penurunan baru telah mula membentuk pada 25 September, yang kini telah berkembang menjadi pola impulsif. Gelombang kelima, sebagaimana

Chin Zhao 15:48 2025-01-06 UTC+2

Analisis EUR/USD pada 3 Januari 2025

Struktur gelombang pada carta 4 jam untuk pasangan EUR/USD semakin jelas dan menarik. Sejak Januari 2024, saya hanya dapat mengenal pasti dua corak tiga gelombang (a-b-c) dengan titik perubahan pada

Chin Zhao 16:38 2025-01-03 UTC+2

Ramalan Mingguan Menggunakan Analisis Gelombang Ringkas untuk EUR/USD, USD/JPY, GBP/JPY, USD/CAD, NZD/USD dan Emas pada 23 Disember

EUR/USD Penganalisaan: Aliran jangka pendek dominan bagi pasangan EUR/USD telah ditentukan oleh gelombang menurun sejak akhir Ogos. Sejak akhir November, gelombang pembetulan telah berkembang dalam bentuk corak mendatar yang berubah

Isabel Clark 13:59 2024-12-23 UTC+2

Ramalan Mingguan Berdasarkan Analisis Gelombang Ringkas untuk GBP/USD, AUD/USD, USD/CHF, EUR/JPY, EUR/GBP dan EUR/CHF – 16 Disember

GBP/USD Analisis Ringkas: Sejak akhir Ogos, pound British telah membentuk gelombang menurun berbanding dolar AS, melemahkan kedudukannya. Segmen ini adalah sebahagian daripada gelombang pembetulan yang lebih besar. Sepanjang tiga minggu

Isabel Clark 14:46 2024-12-16 UTC+2

Ramalan Mingguan Berdasarkan Analisis Gelombang Ringkas untuk EUR/USD, USD/JPY, GBP/JPY, USD/CAD, NZD/USD dan Emas – 16 Disember

EUR/USD Analisis: Arah aliran jangka pendek bagi pasangan utama euro dikendalikan oleh gelombang menurun yang tidak lengkap sejak 26 Ogos. Dalam struktur gelombang ini, segmen pembetulan (B) sedang berkembang

Isabel Clark 14:39 2024-12-16 UTC+2

Ramalan Mingguan Menggunakan Analisis Gelombang Ringkas untuk GBP/USD, AUD/USD, USD/CHF, EUR/JPY, EUR/GBP, dan Indeks Dolar AS setakat 10 Disember

Analisis Ringkas:Arah aliran pound sejak akhir musim panas telah ditentukan oleh gelombang menurun. Gelombang semasa selaras dengan skala jangka masa harian. Tiga minggu lalu, harga telah melantun dari tepi bawah

Isabel Clark 15:59 2024-12-10 UTC+2
Tidak boleh bertanya sekarang?
Tanya soalan anda di Ruangan bersembang.
Panggilan semula Widget
 

Dear visitor,

Your IP address shows that you are currently located in the USA. If you are a resident of the United States, you are prohibited from using the services of InstaFintech Group including online trading, online transfers, deposit/withdrawal of funds, etc.

If you think you are seeing this message by mistake and your location is not the US, kindly proceed to the website. Otherwise, you must leave the website in order to comply with government restrictions.

Why does your IP address show your location as the USA?

  • - you are using a VPN provided by a hosting company based in the United States;
  • - your IP does not have proper WHOIS records;
  • - an error occurred in the WHOIS geolocation database.

Please confirm whether you are a US resident or not by clicking the relevant button below. If you choose the wrong option, being a US resident, you will not be able to open an account with InstaForex anyway.

We are sorry for any inconvenience caused by this message.