GBP/USD 5-Minute Analysis
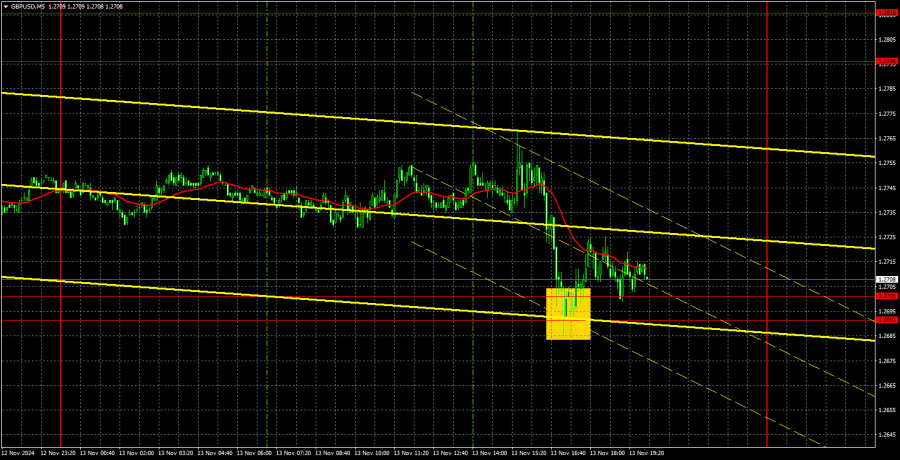
The GBP/USD currency pair continued its decline on Wednesday. Everything mentioned in the EUR/USD analysis is also relevant to the pound. Like the euro, the pound had no fundamental reasons to continue falling on Wednesday, yet it did. To be more precise, the U.S. dollar kept rising for the same reasons we've been outlining since the beginning of the year. At the same time, it's worth noting that the pound is still falling more slowly than the euro. It has encountered the support zone of 1.2691�1.2701, which might result in a minor rebound. However, trying to profit from buying during such a strong downtrend is risky. The market sells every day, so buying is not the best strategy.
We believe the pound could continue its decline regardless of the fundamental or macroeconomic backdrop. Today, speeches by the Bank of England and the Federal Reserve heads are scheduled. Does anyone seriously expect them to support the pound? The market sold off the dollar for two years in anticipation of the Fed's easing monetary policy. Now, it doesn't matter how fast the U.S. central bank lowers rates. Similarly, the speed at which the BoE reduces its rate is becoming less important. Currently, the BoE is reducing rates slowly, which explains why the pound is falling more slowly than the euro. The pound will likely fall faster if the BoE accelerates its rate cuts.
Yesterday, no sell signals were formed on the 5-minute chart. A potential rebound from the 1.2691�1.2701 area should not be considered a buy signal. While a correction is possible, the downtrend is too strong to justify buying.
COT Report
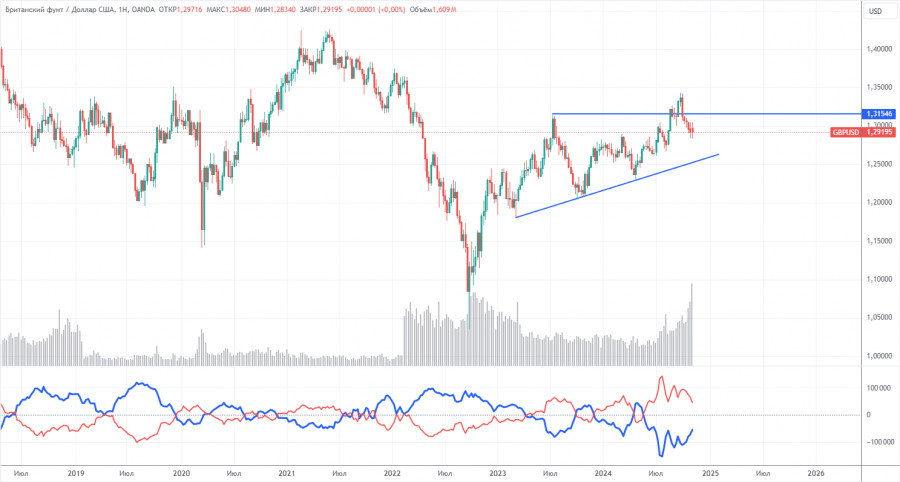
The latest Commitments of Traders (COT) report for the British pound highlights fluctuating sentiment among commercial traders in recent years. The red and blue lines, representing the net positions of commercial and non-commercial traders, frequently intersect and remain near zero. The most recent downtrend coincided with the red line moving below the zero mark. The red line is above zero, and the price has breached the critical level of 1.3154.
The latest COT report shows that the non-commercial group closed 11,900 BUY contracts and opened 9,400 SELL contracts, reducing their net position by 21,300. Despite this, the market remains hesitant to sell the pound in the medium term.
The fundamental backdrop continues not to justify long-term pound purchases. Meanwhile, the currency has a realistic chance of resuming its global downtrend. However, the weekly time frame shows an ascending trendline, so expecting long-term pound depreciation is premature until this line is breached. The pound has been rising against most expectations in the medium term.
GBP/USD 1-Hour Analysis
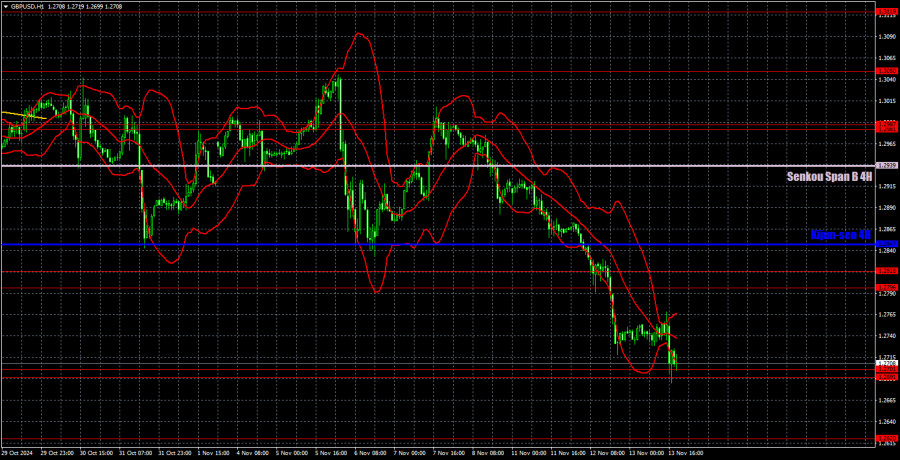
GBP/USD maintains a predominantly bearish outlook on the hourly time frame. The upward trend has been invalidated, leaving further declines for the British currency as the most probable outcome. A recent correction turned into a flat and has now concluded. There's no fundamental reason to expect the dollar to weaken in the medium term. The pound continues its decline without apparent reasons, further affirming our earlier predictions. The pound falls even harder when reasons arise (as on Tuesday). This reflects the natural course of the market.
For November 13, we highlight the following important levels: 1.2796-1.2816, 1.2863, 1.2981-1.2987, 1.3050, 1.3119, 1.3175, 1.3222, 1.3273, 1.3367, and 1.3439. Senkou Span B (1.2939) and Kijun-sen (1.2864) lines can also be sources of signals. Stop-loss orders should be placed at breakeven if the price moves 20 pips in the desired direction. The Ichimoku indicator lines may shift during the day, so consider this when identifying trading signals.
No significant events are scheduled in the UK on Thursday. In the U.S., Jerome Powell is set to speak alongside the release of several less critical macroeconomic reports. All attention will likely focus on Powell's speech.
Chart Explanations:
Support and resistance levels: thick red lines around which movement may end. They are not sources of trading signals.
Kijun-sen and Senkou Span B lines: Ichimoku indicator lines transferred from the 4-hour to the 1-hour timeframe. These are strong lines.
Extreme levels: thin red lines where the price previously rebounded. They are sources of trading signals.
Yellow lines: Trend lines, trend channels, and other technical patterns.
Indicator 1 on COT charts: The net position size for each category of traders.


