অ্যাকচুয়াল প্যাটার্নস
প্যাটার্ন হলো গ্রাফিক্যাল মডেল, যা মূল্য ওঠানামার ভিত্তিতে চার্টে তৈরি হয়। টেকনিক্যাল বিশ্লেষণের নীতি অনুযায়ী, ইতিহাসের (প্রাইস মুভমেন্ট) পুনরাবৃত্তি ঘটে। অর্থাৎ, পরিস্থিতি যদি একই রকম থাকে তাহলে প্রাইস মুভমেন্টও প্রায় একই রকম হয়। এর ফলে মূল্যের ওঠানামা কেমন হবে তা আগেই থেকেই অনুমান করা যায়।
Actual Patterns
- All
- Double Top
- Flag
- Head and Shoulders
- Pennant
- Rectangle
- Triangle
- Triple top
- All
- #AAPL
- #AMZN
- #Bitcoin
- #EBAY
- #FB
- #GOOG
- #INTC
- #KO
- #MA
- #MCD
- #MSFT
- #NTDOY
- #PEP
- #TSLA
- #TWTR
- AUDCAD
- AUDCHF
- AUDJPY
- AUDUSD
- EURCAD
- EURCHF
- EURGBP
- EURJPY
- EURNZD
- EURRUB
- EURUSD
- GBPAUD
- GBPCHF
- GBPJPY
- GBPUSD
- GOLD
- NZDCAD
- NZDCHF
- NZDJPY
- NZDUSD
- SILVER
- USDCAD
- USDCHF
- USDJPY
- USDRUB
- All
- M5
- M15
- M30
- H1
- D1
- All
- Buy
- Sale
- All
- 1
- 2
- 3
- 4
- 5
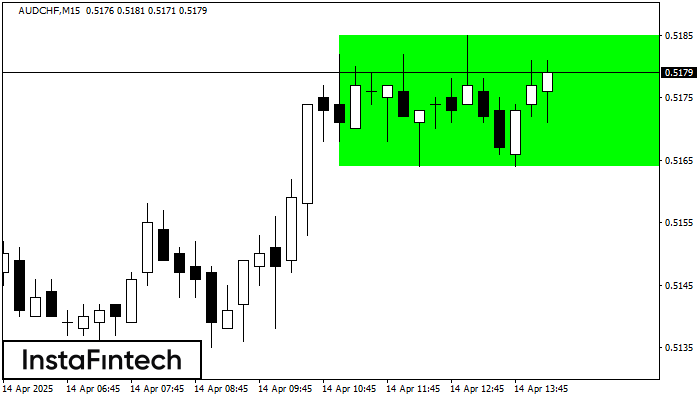
M15 চার্ট অনুসারে, AUDCHF বুলিশ রেক্ট্যাঙ্গেল গঠন করেছে যা চলমান প্রবণতার ধারাবাহিকতার প্যাটার্ন। প্যাটার্নটি নিম্নলিখিত সীমানার মধ্যে রয়েছে: নীচের সীমানা 0.5164 – 0.5164 এবং উপরের সীমানা 0.5185 – 0.5185৷ উপরের
M5 এবং M15 টাইম ফ্রেমে আরও ভুল এন্ট্রি পয়েন্ট থাকতে পারে।
Open chart in a new window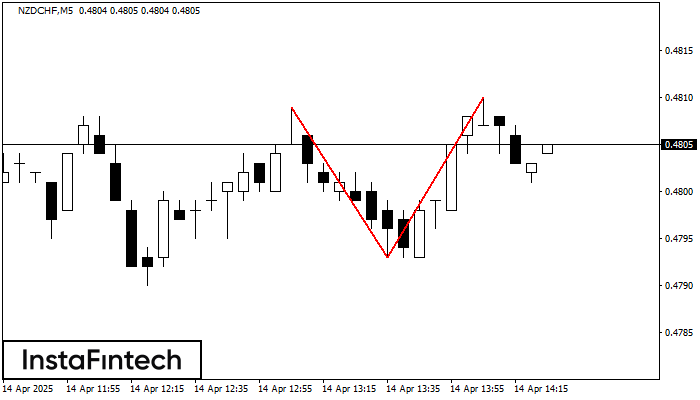
M5 চার্টে, NZDCHF-এর ডাবল টপ রিভার্সাল বা বিপরীতমুখী প্যাটার্ন গঠিত হয়েছে। বৈশিষ্ট্য: উপরের সীমানা 0.4809; নীচের সীমানা 0.4793; প্যাটার্নের প্রস্থ হল 17 পয়েন্ট। 0.4793 0.4778 স্তরের দিকে সম্ভাব্য মুভমেন্টের সাথে
M5 এবং M15 টাইম ফ্রেমে আরও ভুল এন্ট্রি পয়েন্ট থাকতে পারে।
Open chart in a new window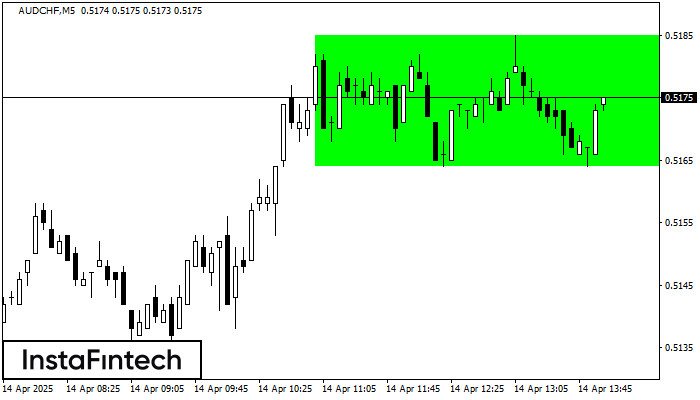
M5 চার্ট অনুযায়ী, AUDCHF বুলিশ রেক্ট্যাঙ্গেল গঠন করেছে। এই প্যাটার্ন চলমান প্রবণতার ধারাবাহিকতা নির্দেশ করে। উপরের সীমানা হল 0.5185, নীচের সীমানা হল 0.5164৷ এই সংকেতের অর্থ হল বুলিশ রেক্ট্যাঙ্গেল -এর
M5 এবং M15 টাইম ফ্রেমে আরও ভুল এন্ট্রি পয়েন্ট থাকতে পারে।
Open chart in a new window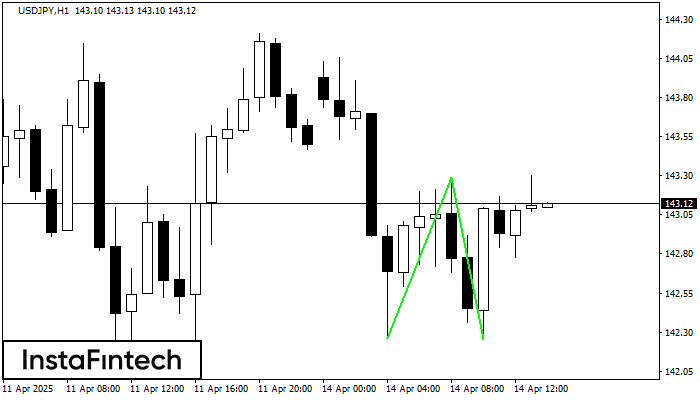
H1 চার্টে, USDJPY-এর ডাবল বটম প্যাটার্নটি গঠিত হয়েছে। বৈশিষ্ট্য: সাপোর্ট স্তর হচ্ছে 142.26; রেজিস্ট্যান্স স্তর হচ্ছে 143.29; প্যাটার্নের প্রস্থ হচ্ছে 103 পয়েন্ট। রেজিস্ট্যান্স স্তর ভেদ করা হলে, 104 পয়েন্টের দূরত্বে
Open chart in a new window
M5 চার্ট অনুযায়ী, NZDJPY বুলিশ সিমেট্রিকাল ট্রায়াঙ্গেল প্যাটার্ন গঠন করেছে। বর্ণনা: এটি একটি ধারাবাহিক প্রবণতার প্যাটার্ন। 84.17 এবং 83.88 হল যথাক্রমে উপরের এবং নীচের সীমানার কোঅর্ডিনেট। চার্টে প্যাটার্নের প্রস্থ
M5 এবং M15 টাইম ফ্রেমে আরও ভুল এন্ট্রি পয়েন্ট থাকতে পারে।
Open chart in a new window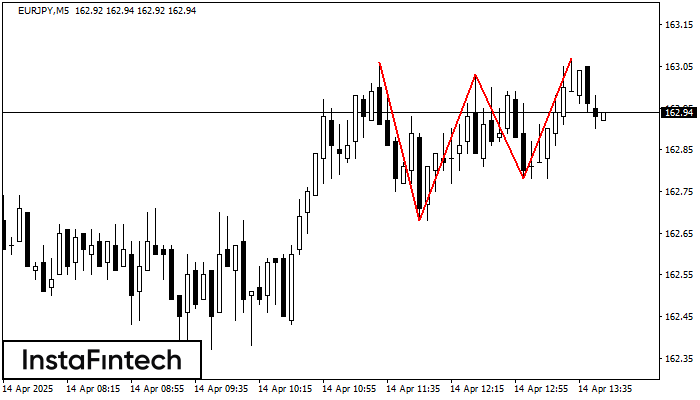
M5 চার্টে EURJPY-এর ট্রিপল টপ প্যাটার্নটি গঠিত হয়েছে। প্যাটার্নের বৈশিষ্ট্য: এই প্যাটার্নের সীমানাগুলোতে একটি ঊর্ধ্বমুখী অ্যাঙ্গেল বা কোণ আছে; প্যাটার্নের নীচের লাইনে 162.68/162.78-এর কোঅর্ডিনেট রয়েছে, উপরের সীমা 163.06/163.07; প্রস্থের প্রজেকশন
M5 এবং M15 টাইম ফ্রেমে আরও ভুল এন্ট্রি পয়েন্ট থাকতে পারে।
Open chart in a new window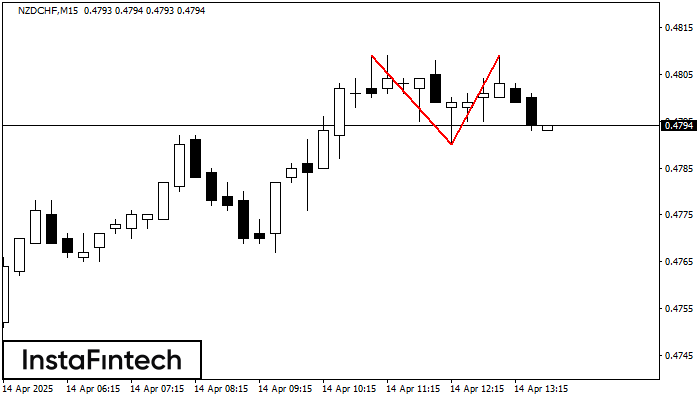
M15 চার্টে, NZDCHF-এর ডাবল টপ প্যাটার্নটি গঠিত হয়েছে। এটি এই ইঙ্গিত দেয় যে চলমান প্রবণতা ঊর্ধ্বমুখী থেকে নিম্নমুখীতে পরিবর্তিত হয়েছে। সম্ভবত, যদি 0.4790 প্যাটার্নের ভিত্তিটি ব্রেক করা হয়, তাহলে নিম্নমুখী
M5 এবং M15 টাইম ফ্রেমে আরও ভুল এন্ট্রি পয়েন্ট থাকতে পারে।
Open chart in a new window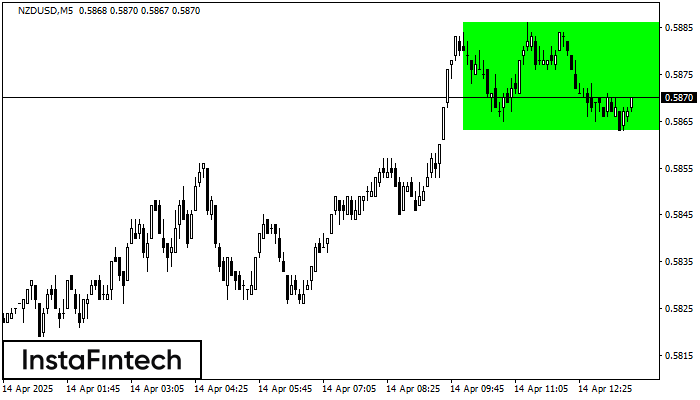
M5 চার্ট অনুযায়ী, NZDUSD বুলিশ রেক্ট্যাঙ্গেল গঠন করেছে। এই প্যাটার্ন এই ধরনের প্রবণতার ধারাবাহিকতার নির্দেশ করে. এটি দুটি স্তর নিয়ে গঠিত: 0.5886 -এর রেজিস্ট্যান্স এবং 0.5863 -এর সাপোর্ট৷ রেজিস্ট্যান্স স্তর
M5 এবং M15 টাইম ফ্রেমে আরও ভুল এন্ট্রি পয়েন্ট থাকতে পারে।
Open chart in a new window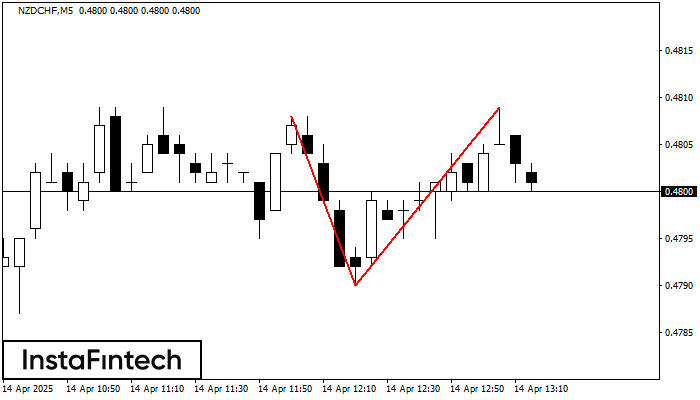
M5 চার্টে, NZDCHF-এর ডাবল টপ রিভার্সাল বা বিপরীতমুখী প্যাটার্ন গঠিত হয়েছে। বৈশিষ্ট্য: উপরের সীমানা 0.4809; নীচের সীমানা 0.4790; প্যাটার্নের প্রস্থ 19 পয়েন্ট। সংকেত: নীচের সীমানা ব্রেক করা হলে 0.4775 স্তরের
M5 এবং M15 টাইম ফ্রেমে আরও ভুল এন্ট্রি পয়েন্ট থাকতে পারে।
Open chart in a new window